3D nézet

A 3D nézet a VisioVIEW CT-megjelenítő leghtékonyabb funkciója, amely lehetővé teszi a felhasználók számára a volumetrikus DICOM adatok vizualizálását és interakcióját. A 3D nézet aktiválásához válassza a bal oldali eszköztárból a MPR + 3D nézet opciót, vagy a megjelenítő menüjéből a Nézet -> 3D opciót.
A 3D nézet virtuális 3D rekonstrukciót biztosít a vizsgált objektumról, lehetővé téve a felhasználók számára a 3D modell forgatását, nagyítását és manipulálását a jobb megértés és elemzés érdekében.
A 3D objektum orientálása
A 3D nézetre váltáskor a 3D modell rekonstruálódik és láthatóvá válik a megjelenítő bal oldalán, míg a jobb oldalon a három MPR nézet jelenik meg.
A 3D térfogat forgatása
A 3D térfogat forgatásához válassza a Elem kijelölése/mozgatása eszközt, és rendelje hozzá az elérhető egérgombok egyikét. Nyomja le és tartsa lenyomva a térfogatot a forgatás megkezdéséhez, majd húzza az egeret a kívánt irányba a forgatáshoz.
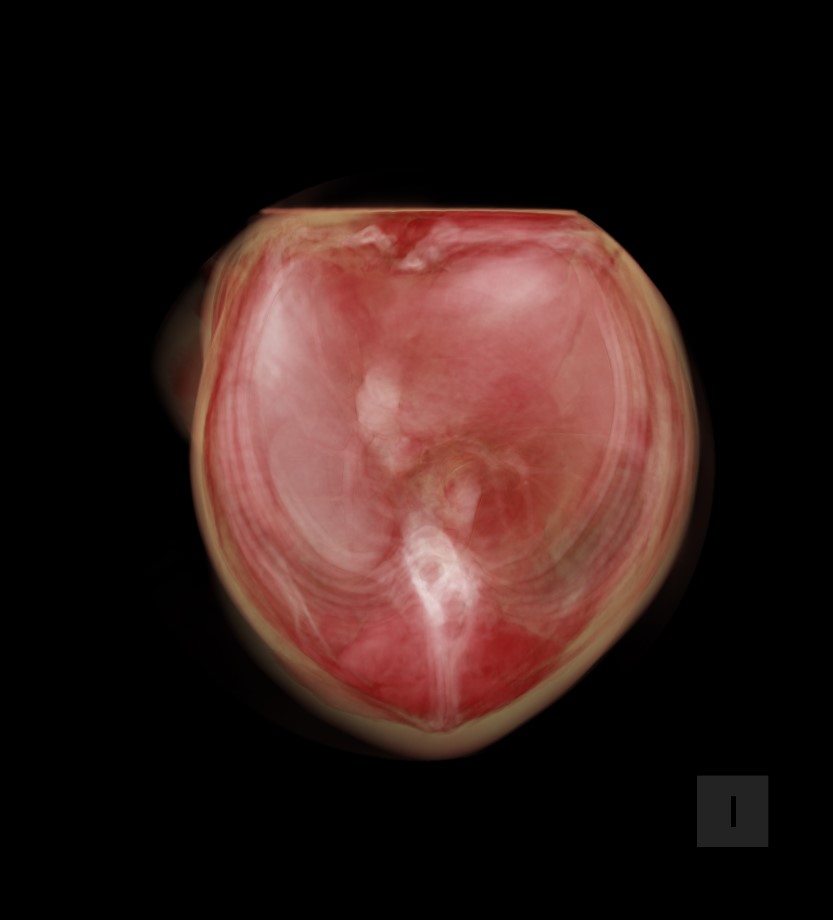
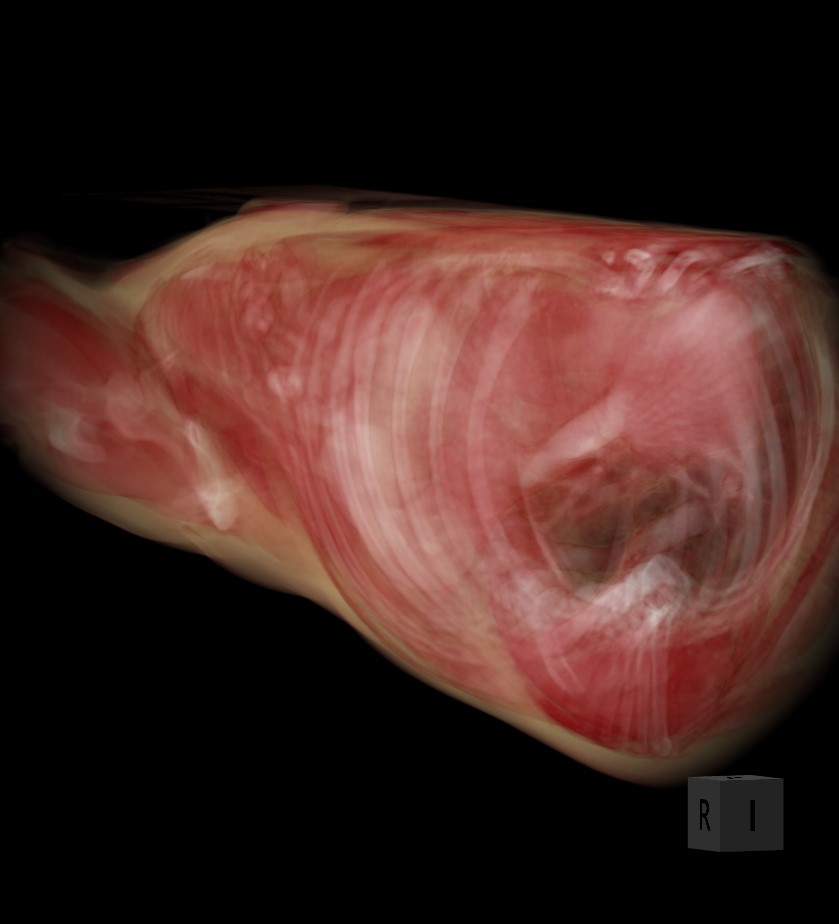
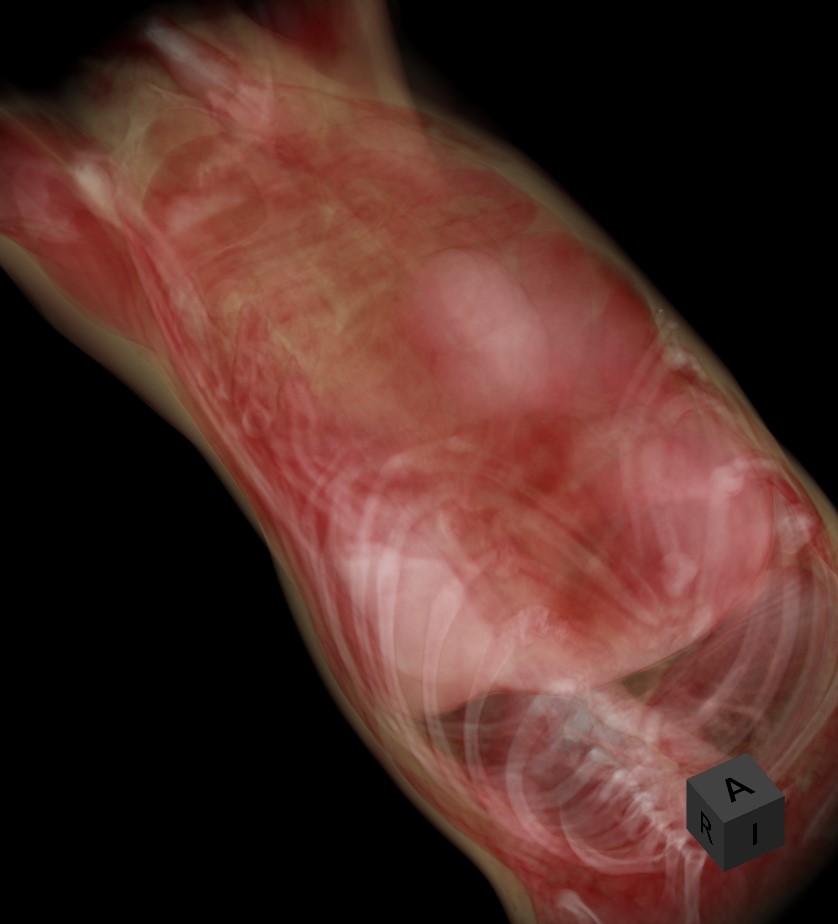
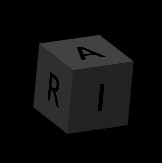
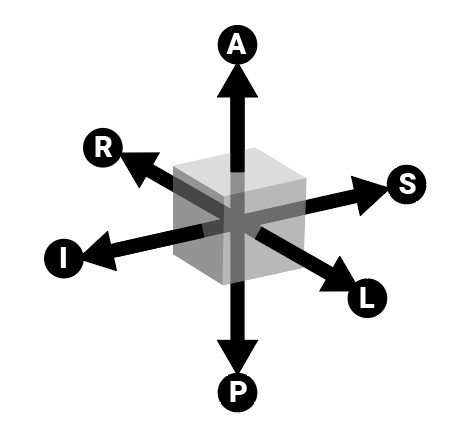
Az alsó jobb sarokban megjelenő 3D orientációs kocka jelzi a síkok aktuális helyzetét.
A kocka oldalai az RAS koordinátarendszerre utalnak: A (Elülső), P (Hátsó), L (Beteg bal oldala), R (Beteg jobb oldala), S (Felső) és I (Alsó).
A 3D térfogat igazítása
A 3D térfogat objektum egy adott oldalhoz történő pontos igazításához kattintson a megfelelő betűre, amely az adott oldalt jelöli a megjelenítő alsó részén.
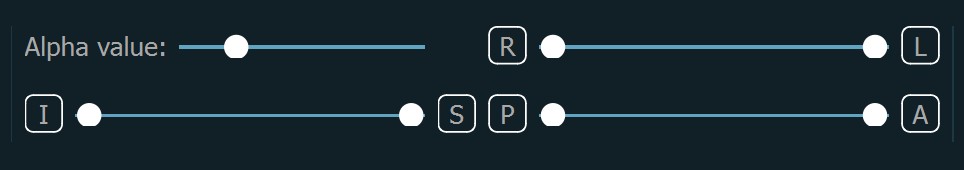
A felhasználók a síkokon látható szeletek tartományát is beállíthatják. Alapértelmezés szerint az egész 3D térfogat betöltődik a nézetablakba. A térfogat módosításához és vágásához használja a megjelenítő alsó részében található három csúszkát.
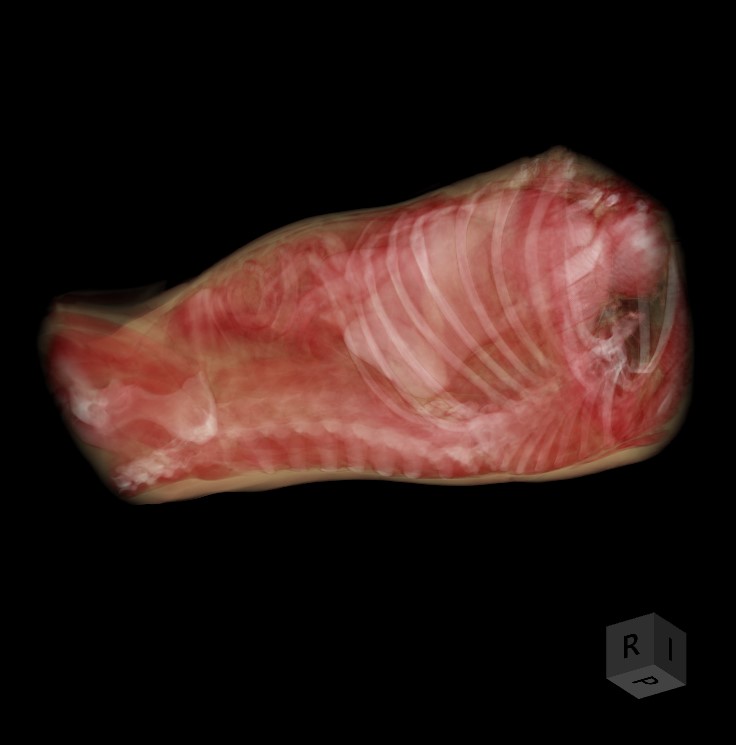
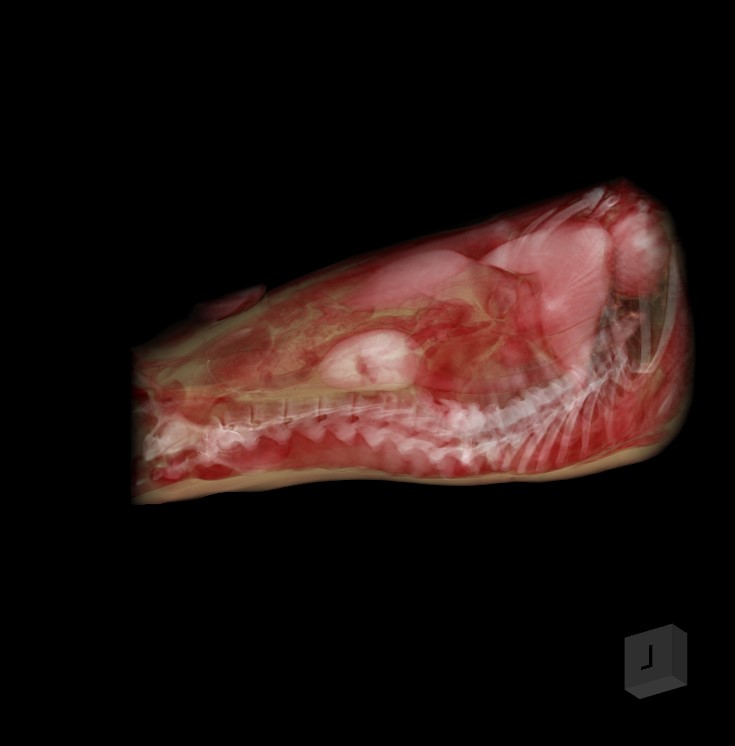
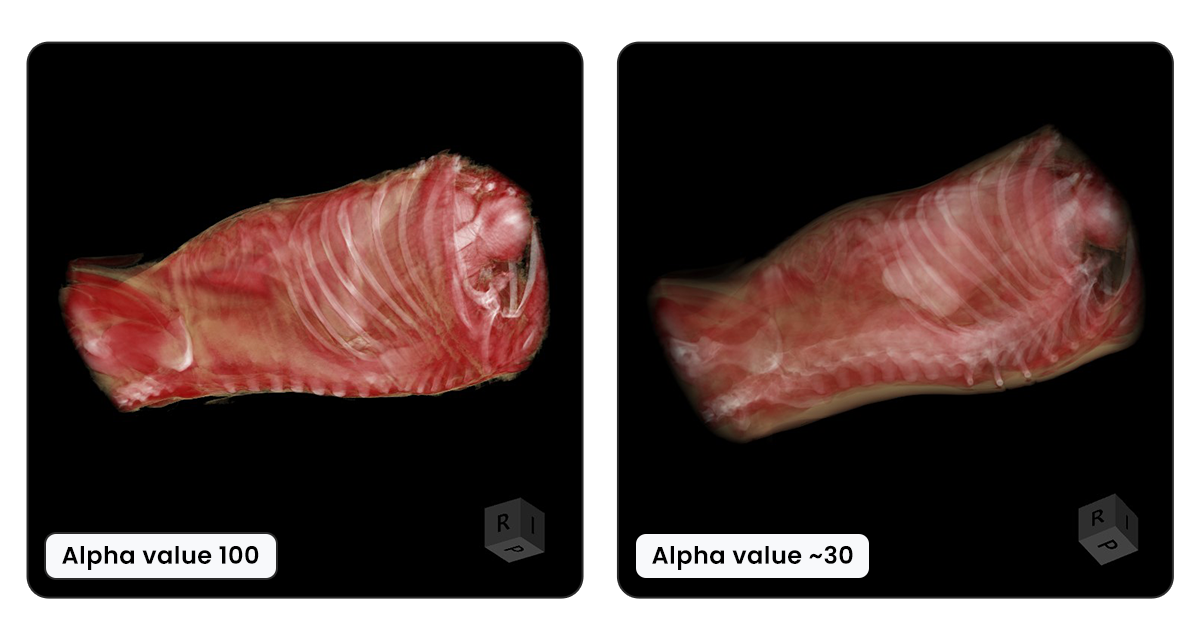
A 3D modell összes szeletének átlátszóságának egyidejű beállításához húzza az Átlátszóság értéke csúszkát a kívánt irányba. A CT megjelenítő alapértelmezett átlátszóságát a jobb oldali kép mutatja, míg a bal oldali kép a teljesen átlátszatlan 3D térfogatot ábrázolja.
Megjelenítési módok
A megjelenítési módok olyan vizualizációs technikák, amelyek a térfogat-alapú DICOM adatok megjelenítésére szolgálnak, és mindegyik egy-egy egyedi módot kínál a belső struktúrák értelmezésére.
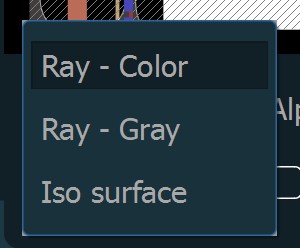
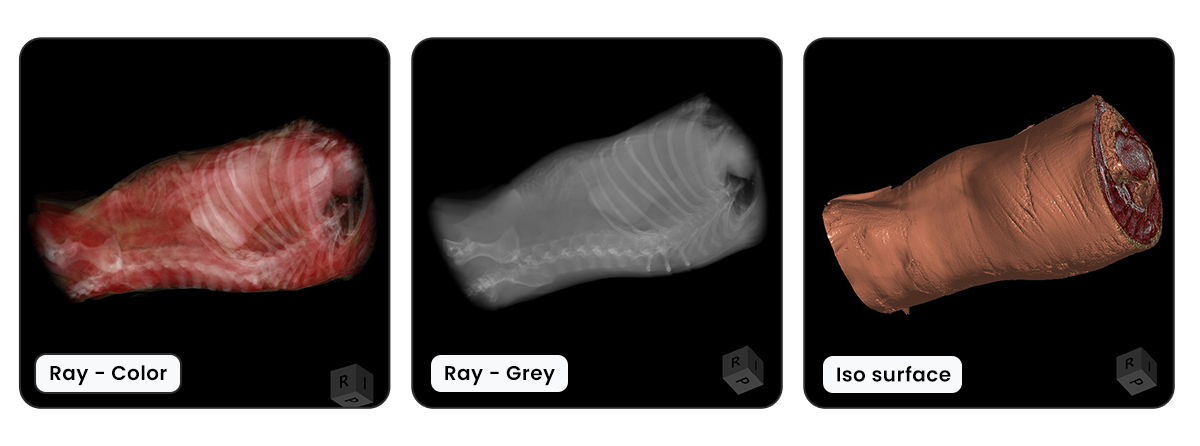
A 3D térfogat megjelenítéséhez három megjelenítési mód áll rendelkezésre.
Sugár - Szín: A 3D térfogatot a test összes voxelének HU (Hounsfield-egység) értékei alapján hozza létre, és ehhez specifikus színeket rendel.
Sugár - Szürke: Ugyanezt az elvet használja, mint a Sugár - Szín megjelenítési mód, azonban a voxel-ekhez színek helyett szürkeárnyalatokat rendel.
Isofelület: Létrehoz egy 3D felületet, amely a térfogat-alapú DICOM adatokat ábrázolja, kiemelve a test külső és bizonyos belső struktúráit.
3D Ablakolás
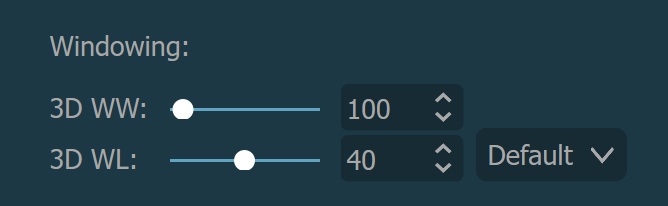
A 3D térfogat ablakolása ugyanúgy történik, mint az MPR ablakolása, azonban a két beállítás külön van kezelve, így nem zavarják egymást. További információ az ablakolás módosításáról a következő szakaszban található.
HU-eloszlás

A HU-eloszlás vizuális ábrázolást nyújt a 3D térfogatban található szöveti sűrűségek tartományáról és azok eloszlásáról. A felhasználók különböző színeket vagy színtartományokat rendelhetnek a különböző szöveti sűrűségekhez, hogy ezek alapján vizuálisan megkülönböztethessék és tanulmányozhassák azokat.
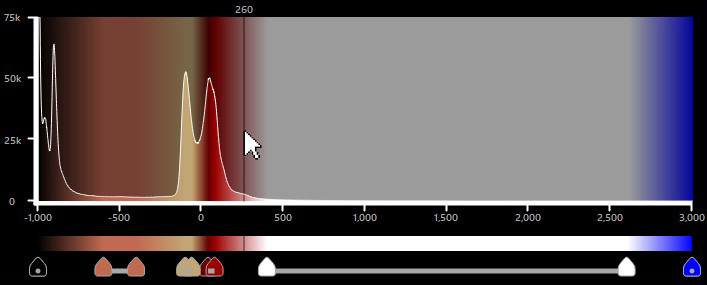
A HU-eloszlást egy hisztogram ábrázolja, amely megjeleníti a voxel-ek gyakoriságát a térfogatban minden egyes HU értéknél. A HU értékek -1000 és 3000 között mozognak.
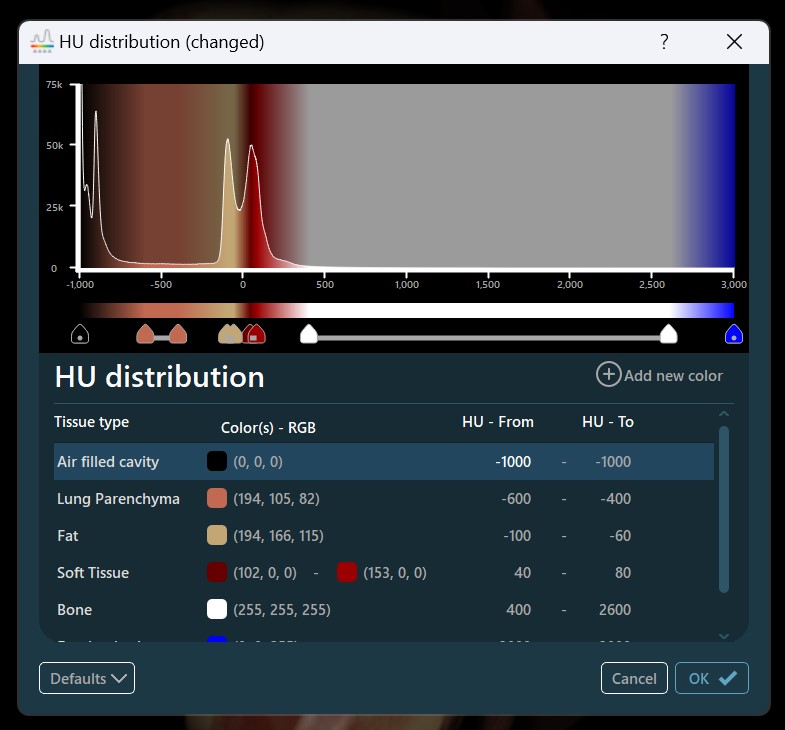
HU-eloszlási panel
A hisztogram függőleges tengelye a voxel-ek számát, míg a vízszintes tengely a HU értékek rendelkezésre álló tartományát mutatja. A hisztogram a HU egységek tényleges színeloszlását is megjeleníti.

A színtartományok végpontjaihoz különböző színek rendelhetők. Ha a végpontok színei különböznek, a tartomány a két szín közötti lineáris átmenetet fogja tartalmazni. Ezenkívül a különböző tartományok két végpontja közötti rés is a színek lineáris átmenetével töltődik ki.
A VisioVIEW CT megjelenítő alapértelmezett szövet HU tartományai automatikusan beállításra kerülnek, és a hisztogram alatti táblázatban jelennek meg.
Színtartományok módosítása
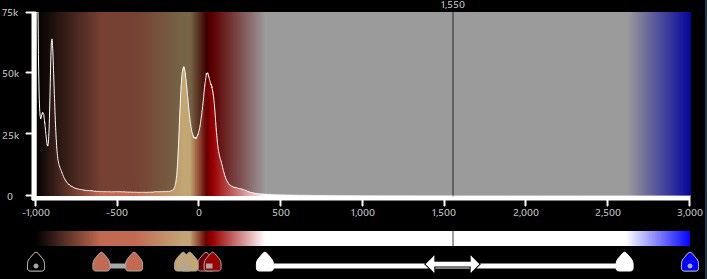
Egy teljes színtartomány elmozgatásához a hisztogramon, helyezze az egeret a tartomány fölé, nyomja le, majd húzza a tartományt a kívánt irányba.
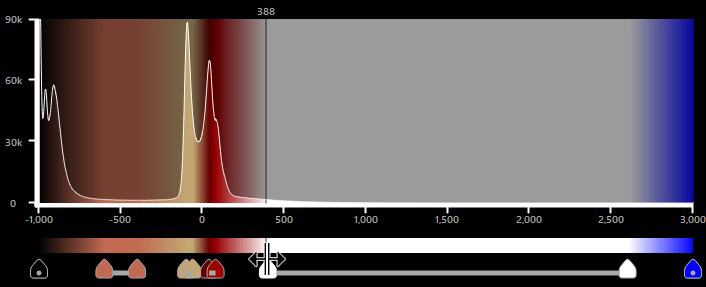
A tartományok növeléséhez vagy csökkentéséhez nyomja le, majd húzza a tartomány végpontjait a kívánt irányba.
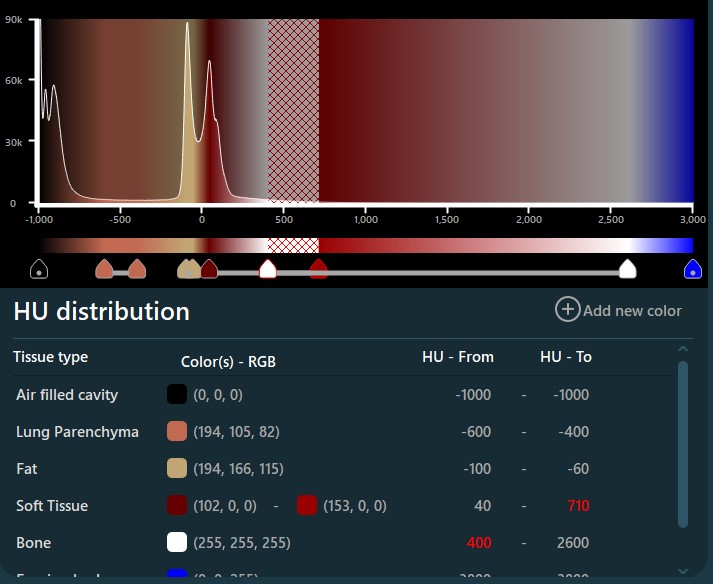
Ha két HU tartomány átfedésben van, az átfedő terület érvénytelenné és inaktívvá válik. Az érvénytelen tartományokat a hisztogram hálós mintázata, a tartományok végpontjainak piros kerete és a táblázatban pirossal kiemelt értékek jelzik.
A tartomány minden egyes végpontjának színét úgy módosíthatja, hogy duplán kattint a kívánt végpontra. Egy teljes tartomány egyszerre történő módosításához duplán kattintson magára a tartományvonalra, vagy duplán kattintson az alábbi bejegyzések egyikére.
Egyes színek módosítása
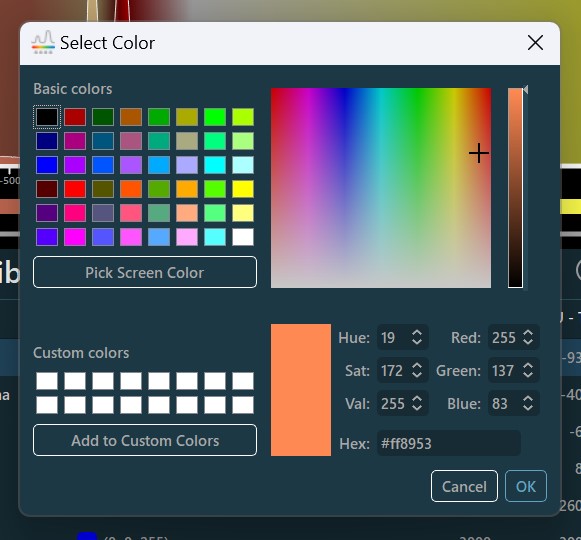
A tartomány minden végpontjának színe egyénileg frissíthető a Szín kiválasztása párbeszédablakból történő opcióválasztással. A felhasználók választhatnak az elérhető előre beállított színek közül, a jobb oldali színválasztóból, vagy a Képernyő színének kiválasztása opciót használva a képernyő bármely pontjáról felvehetnek színt.
Ezenkívül a felhasználók manuálisan beállíthatják a Hue (árnyalat), Saturation (telítettség) és Value (érték) paramétereket az HSV színrendszer szerinti szín meghatározásához, a Red (piros), Green (zöld) és Blue (kék) csatornákat az RGB színrendszer szerinti szín meghatározásához, vagy megadhatják a szín hexadecimális értékét a mezőben.
A jelenleg aktív szín hozzáadható és elmenthető az egyéni színekhez a későbbi felhasználás érdekében. Az aktív szín mentéséhez nyomja meg a Hozzáadás az egyéni színekhez gombot.
Erősítse meg a módosításokat és zárja be a párbeszédablakot a OK gomb megnyomásával, vagy törölje a változtatásokat a Mégse gomb megnyomásával.
Színtartományok szerkesztése panel
A tartomány nevét a tartomány aktuális neve előtti Szerkesztés ikon használatával módosíthatja.
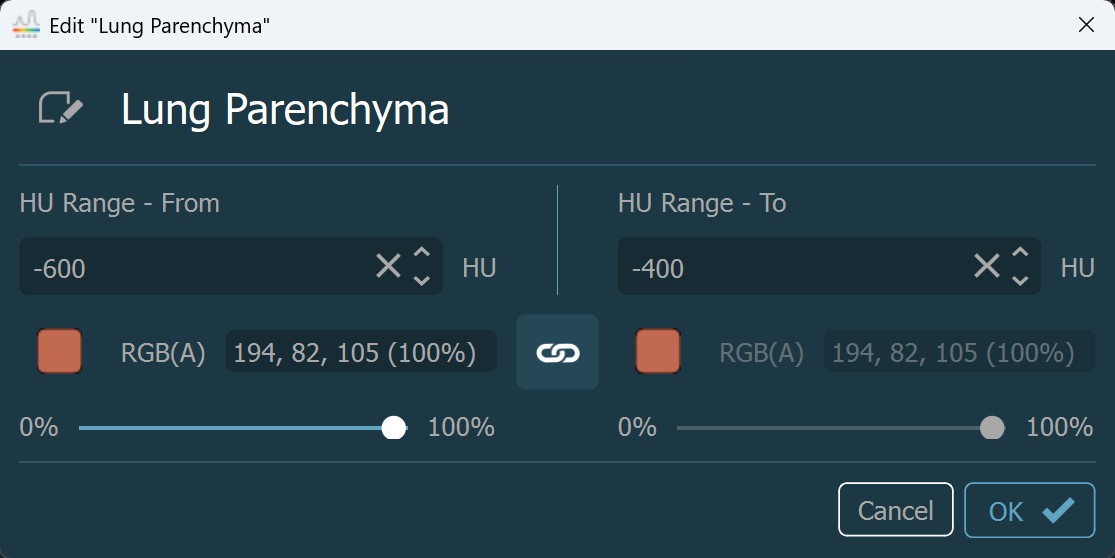
A párbeszédablak lehetőséget kínál arra, hogy a tartomány minden végpontját egyénileg szerkessze. A tartomány kezdő HU értékét és színét a HU Tartomány - tól részben, míg a tartomány záró HU értékét és színét a HU Tartomány - ig részben adhatja meg.
A tartomány minden végpontjának színe egyedileg választható a végpont színének megnyomásával, amely megnyitja a fent említett párbeszédablakot. A végpont színének átlátszóságának módosításához húzza az alatta található csúszkát a kívánt irányba.
Ha a tartomány kezdő- és végpontjához ugyanazt a színt szeretné beállítani, nyomja meg a két szín közötti Link ikont. A színek szétkapcsolásához a gombot ismételten ki- és bekapcsolhatja.
Erősítse meg a tartomány módosításait a OK gomb megnyomásával, vagy törölje a párbeszédablakot a Mégse gomb megnyomásával.
Új színtartomány hozzáadása
Új színtartomány hozzáadásához duplán kattintson a hisztogramra a kívánt HU értéknél, amelyet a fölé húzott függőleges vonal jelez. A tartomány kezdő HU értékét és színét a hisztogramon kiválasztott pozíció alapján állíthatja be.
A felhasználók az Új szín hozzáadása gomb használatával is hozzáadhatnak új színtartományokat. Mindkét eset ugyanazt a Színtartomány szerkesztése panelt nyitja meg, mint korábban, de más céllal.
Tartományok módosítása és törlése a táblázatból
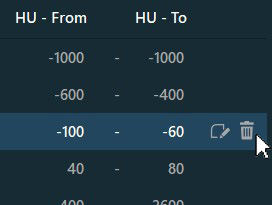
Szerkesztés ikont, mely akkor jelenik meg, amikor az egeret a kiválasztott bejegyzés fölé viszi a táblázatban.Törlés ikont, mely akkor jelenik meg amikor az egeret a kiválasztott bejegyzés fölé viszi a táblázatban.Előre beállított opciók
Mentés alapértelmezettként: Mentse el a módosított HU eloszlást alapértelmezett előbeállításként, amelyet a VisioVIEW szoftver a CT megjelenítő használata során alkalmaz. Válassza a
Alapértelmezett -> Mentés alapértelmezettkéntopciót a párbeszédablak alján található legördülő menüből.Mentett alapértelmezett betöltése: Állítsa vissza a HU eloszlás aktív módosításait az utoljára elmentett alapértelmezett betöltésével. A
Alapértelmezett -> Mentett alapértelmezett betöltésemenüpont le van tiltva, ha korábban nem mentettek előbeállítást.VisioVIEW alapértelmezett betöltése: Töltse be a VisioVIEW szoftver gyári HU eloszlását a
Alapértelmezett -> VisioVIEW alapértelmezett betöltéseopcióval.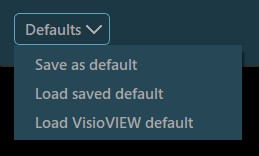
Erősítse meg a HU eloszlás minden módosítását a OK gomb megnyomásával. A függőben lévő változtatások elvetéséhez nyomja meg a Mégse gombot.